Visualizing Adversary Techniques
- Adversary techniques can be obtained from your intel analysts or any threat intel reports – these are the techniques you want to hunt/monitor for
- If duplicate technique IDs are added to the text file, then the conversion script will give those techniques higher scoring relative to other techniques – increasing the color gradient when visualized
-
Manually populate a simple text file with MITRE ATT&CK technique and sub-technique IDs (T####, T####.###) – one per line
-
Copy the
Convert-TIDsToATTACK.psm1script (found in\\fileserver\share\share\SCRIPTS\262COS-MITRE_ATTACK_Scripts-PACKAGE-001\) to your Windows host -
Open a PowerShell terminal, navigate to the script location, and import the script as a module:
Import-Module -Force .\Convert-TIDsToATTACK.psm1 -
Run the
Convert-TIDsToATTACKscript against the file containing the list of MITRE ATT&CK technique and sub-technique IDs to convert it to a MITRE ATT&CK Navigator Layer JSON file:Convert-TIDsToATTACK -File "<TECHNIQUE_ID_LIST_FILE>" -Output "technique_id_coverage.json" -
From the MITRE ATT&CK Navigator, click on the
+plus sign at the top of the page next to the existing layer name (Detection Rule Coverage) -
Click on Open Existing Layer -> Upload from Local and upload your newly converted
technique_id_coverage.json -
A new layer named
Technique Coveragewill be loaded: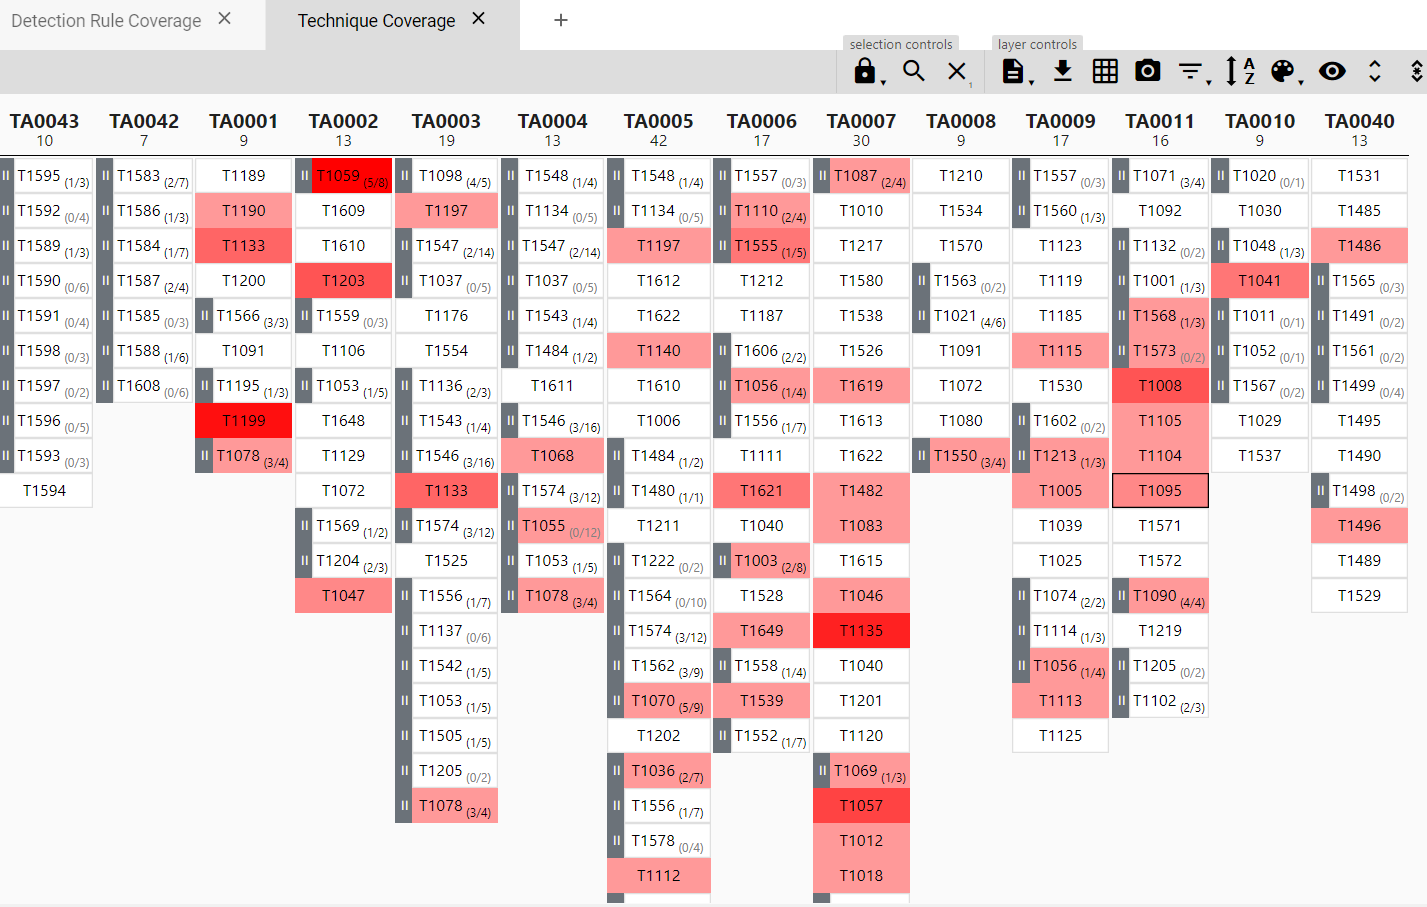
-
You can now customize the layer visuals and render layer to SVG to export the layer as an SVG image file, if desired